my_random_numbers = sample(100, sample(10:100, 1))
length(my_random_numbers)
my_random_numbers[1]
tail(my_random_numbers, n=1)
B1 = matrix( sample(100), nrow=10, ncol=10)
B2 = matrix( sample(100), nrow=10, ncol=10)
B = B1 %*% B2
print(B1[,1])
print(B2[10,])
print(diag(B))
#library(devtools)
#install_github("Gibbsdavidl/CatterPlots")
library(CatterPlots)

x <- -10:10
y <- -x^2 + 10
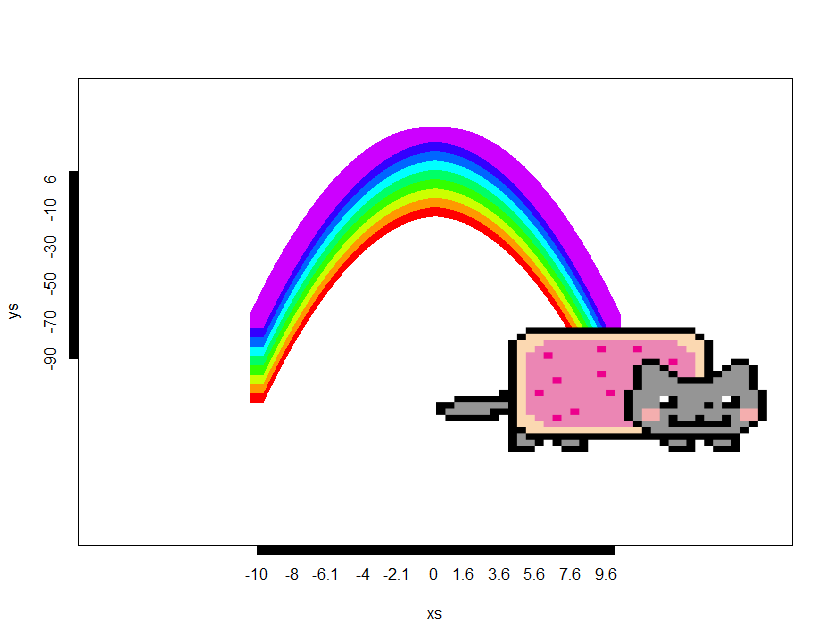
rainbowCats(x, y, yspread=0.05, xspread=0.05, ptsize=2, catshiftx=0.5, catshifty=-0.2, canvas=c(-0.5,1.5,-1,1.5))
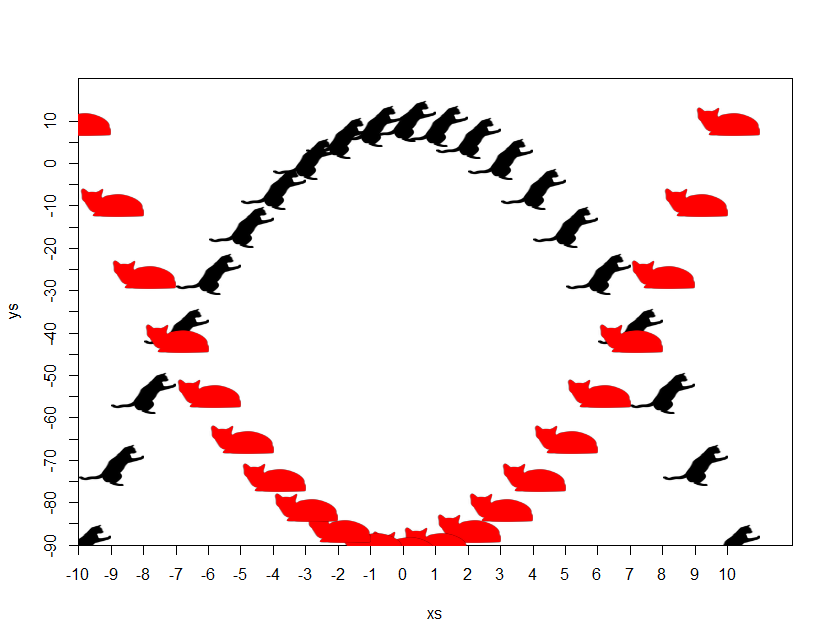
purr <- catplot(xs=x, ys=y, cat=3, catcolor='#000000FF')
cats(purr, -x, -y, cat=4, catcolor='#FF0000')
# for more fun ...
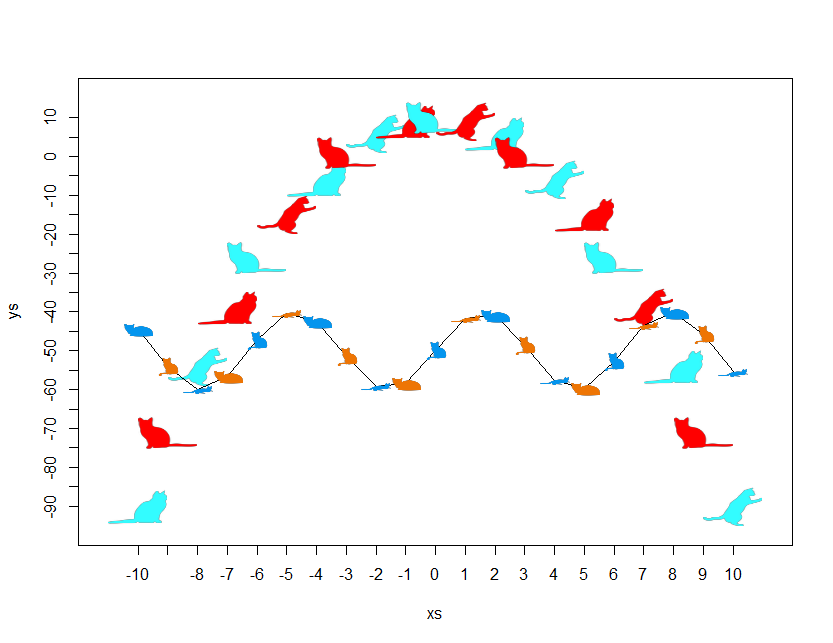
meow <- multicat(xs=x, ys=y, cat=c(1,2,3), catcolor=list('#33FCFF','#FF0000'), canvas=c(-0.1,1.1, -0.1, 1.1))
morecats(meow, x, 10*sin(x)+40, size=0.05, cat=c(4,5,6), catcolor=list('#0495EE','#EE7504'), type="line")
# random cats
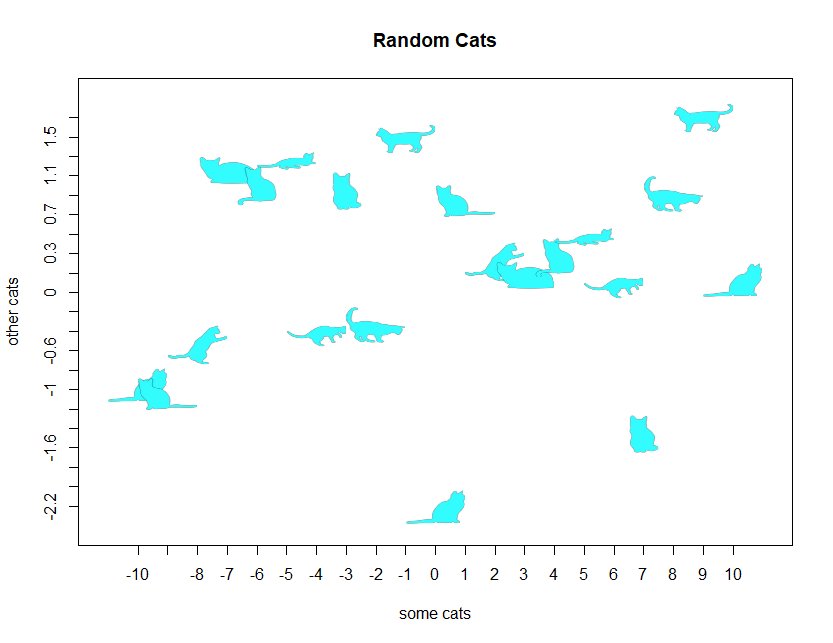
meow <- multicat(xs=x, ys=rnorm(21),
                 cat=c(1,2,3,4,5,6,7,8,9,10),
                 catcolor=list('#33FCFF'),
                 canvas=c(-0.1,1.1, -0.1, 1.1),
                 xlab="some cats", ylab="other cats", main="Random Cats")
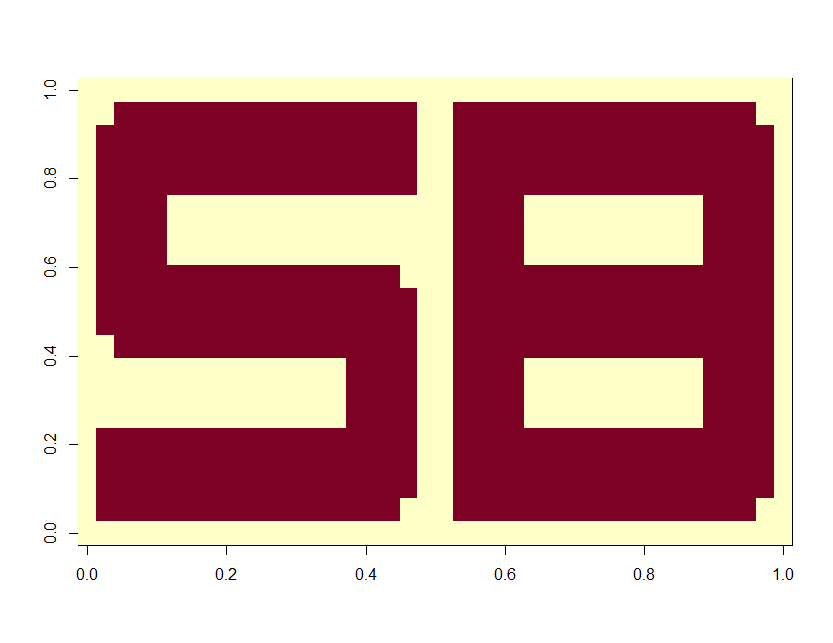
## S B example
matA = matrix(0, ncol=40, nrow=20)
matA[2:5,2:39]   = 3
matA[9:12,2:39]  = 3
matA[16:19,2:39] = 3

matA[3:4,2:39]   = 3
matA[10:11,2:39] = 3
matA[17:18,2:39] = 3

matA[3:19,2:5]   = 3
matA[2:19,16:19] = 3
matA[2:19,22:25] = 3
matA[2:19,36:39] = 3


matA[,20:21] = 0
matA[6:8,2:5] = 0
matA[13:15,16:19] = 0

matA[19,39] = 0
matA[19,2] = 0
matA[2,39] = 0
matA[2,19] = 0
matA[12,19] = 0
matA[9,2] = 0

image(t(matA))
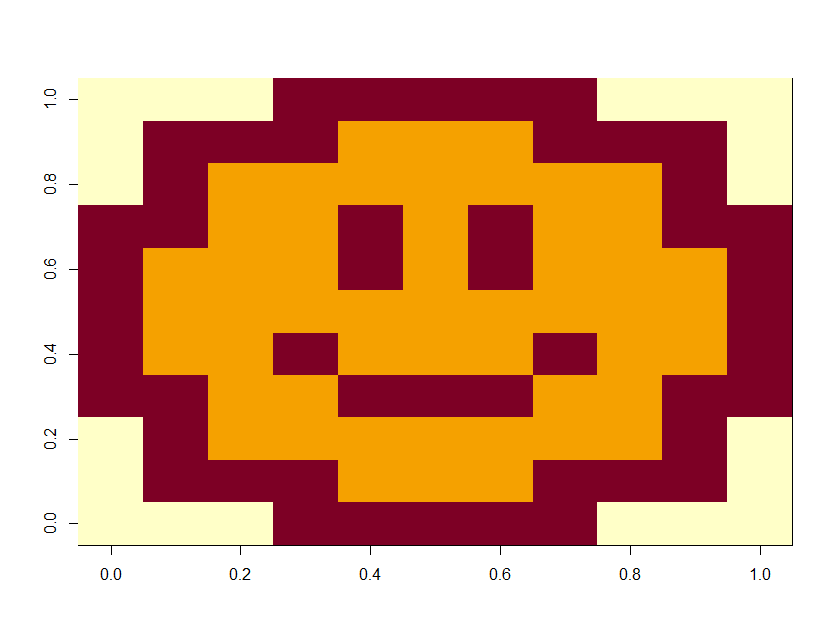
## Smiley face
circle <- function(r) { x = (-100:100)/100; y = sqrt(r^2 - x^2  ); return(rbind(cbind(x,y), cbind(x,-y) )) }

matB = matrix(1, ncol=11, nrow=11)
tt = (circle(1))
tt = (tt + 1)
tt2 = (round(tt/2,1)  * 10  ) + 1
matB[tt2] = 2
matB[c(7:8),5] = 2
matB[c(7:8),7] = 2
matB[4,5:7] = 2
matB[5,c(4,8)] = 2

matB[c(1:3,9:11),c(1,11)] = 0
matB[c(1,11),c(1:3,9:11)] = 0

image(t(matB))
