ayotochtli
This project is maintained by sarbal
Figure 4
source("armadillo_helper.r")
source("load_fig4_data.r")
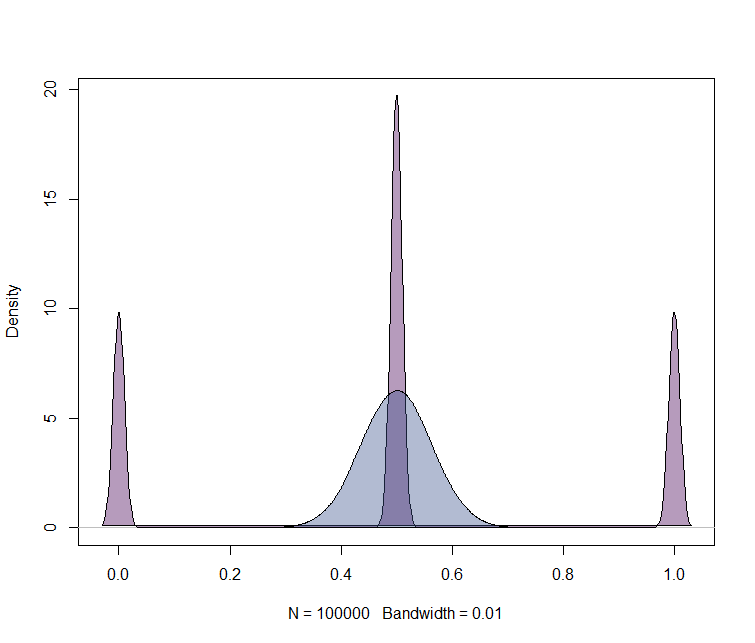
Panel A
### Calculate and plot density for background ASE
ase_data = lapply( c(2,64), function(i) rbinom(1e5, i, 0.5)/i )
ase_dens = lapply(1:2, function(i) density(ase_data[[i]] , bw=0.01))
plot(ase_dens[[1]], col=0 , main="")
lapply(1:2, function(i) polygon(ase_dens[[i]], col=EGAD::make_transparent(viridis(5))[i]))
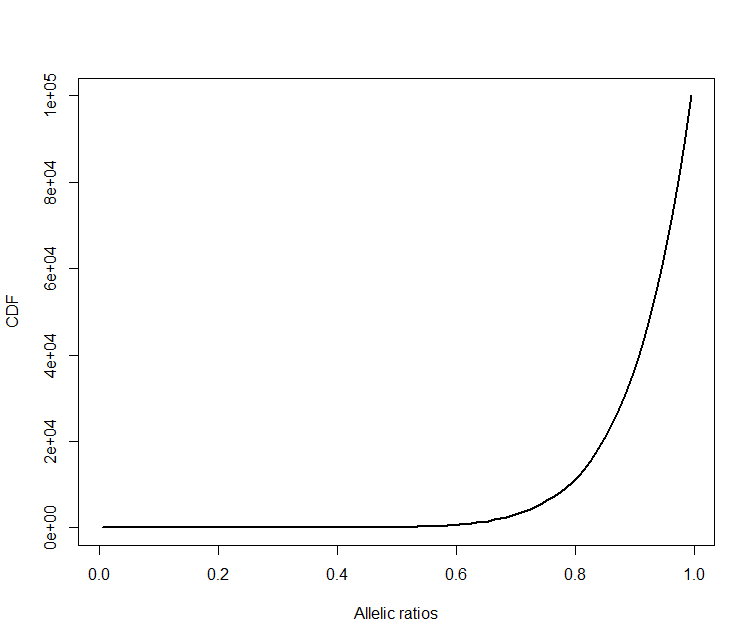
### Calculate and plot CDF for disease model background
dise_data =  rbeta(1e5, 10, 1)
hd = hist(dise_data, breaks=c(0:100)/100)
cdf = cumsum(hd$counts )
plot(hd$mids, cdf, type="l", lwd=2, xlab="Allelic ratios", ylab="CDF")
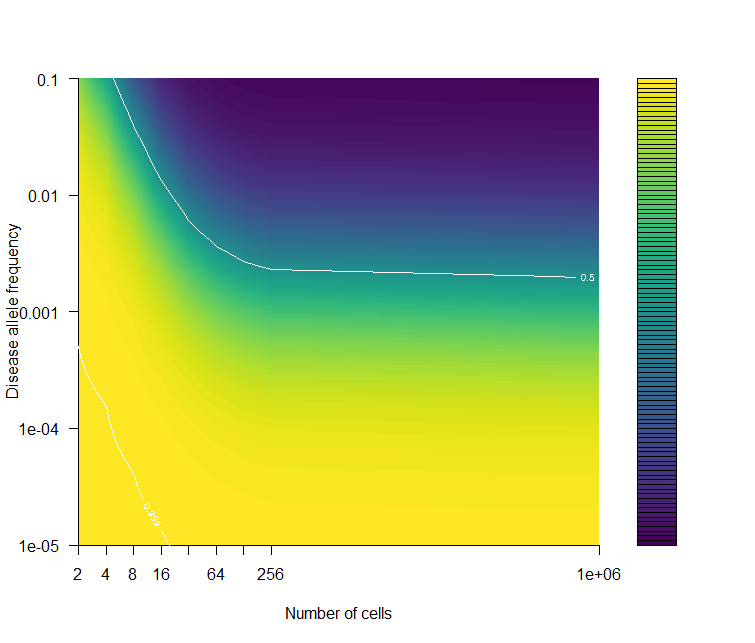
Panel B
mat = mat.list$both
mat[mat == 0] = 1e-20

x = log2(cnum)
y = rev(-mutation_rate)
xa = sort(rep(x, length(y)))
ya = rep(y, length(x))
ya[is.na(ya)] = 0
za = array(mat[41:1,] )
temp2 = cbind(xa,ya,za)[!is.na(za),]
zi = interp(temp2[,1],temp2[,2], temp2[,3])


conts = c(0,0.5,1)
x = list()
yo = list()
for(i in 1:length(conts) ) {
    cont = which(round(zi$z, 1) == conts[i], arr.ind=T)
    x[[i]] = zi$x[cont[,1]]
    y = zi$y[cont[,2]]
    o = order(x[[i]])
    x[[i]]= x[[i]][o]
    y = y[o]
    lo = loess(y~x[[i]])
    yo[[i]] = predict(lo)
}


filled.contour( log2(cnum), rev(-mutation_rate), t( mat[41:1,]),
                col= viridis(100), levels=(0:100)/100, axes=F,
                xlab="Number of cells",
                ylab="Disease allele frequency", frame.plot=F,
                plot.axes = {
                    axis(1, at=log2(cnum), lab=cnum ) ;
                    axis(2, at=-5:-1, lab= 10^(-5:-1));
                    contour(log2(cnum),  rev(-mutation_rate) ,   t( mat[41:1,]),
                            levels = c(0.01,0.5,0.999 ), add=T, col="white") ;
                }
)